Biological form and function
Towards functional principals of spatial shape in developmental biology.
Dr. A. Kraemer
Dept. of Biochemistry / Busse-Lab
CAU Kiel /
October 2001
elegans.uni-kiel.de / kraemer at email.uni-kiel.de
In biology shape is designed to fulfill certain biological functions. Until now it is not known, how biological shape (i.e. a cell aggregate or a protein) is made and in how this shaped object becomes functional. Here a small step on the way towards the explanation of the relation between biological shape and function is made. The final result is the application of vector space concepts and matrix operations in the unique formulation developmental biological.
This work reflects on the processes of cell movements in an egg of an embryo (of a tiny worm called C. elegans) to complete the embryos spatial 3D shape. Once all cells have found each others neighbor, all biological functions are determined for future development.
Abstract:
In
the premorphogenetic phase (in the Egg of C. elegans) the major events are cell
division and cell migration. At the end of this phase the cells are positioned
(sorted and connected) in a way that morphogenesis can start. The topological
cell contacts i.e. their connectivity forms a vector space, which allows a normalized,
and in 4D time-space even static description of the topological development. By
a metric (i.e. a measure of distances), the development in a geometric space may
be visualized. By adding an orientation to the vector space, physical force-flux
laws and potential functions may be introduced, that govern the development.
Take Home:
Summary of relevant aspects
Context:
Several organisms have been subject to intense applications of biochemical technologies. Some model organisms exhaustively served as playground for all known and unknown techniques of manipulations, genome analysis, cloning etc.
However it is still not known how biological function is defined. The core questions may be stated as
An analysis suite called Topologizer is a bio-application being developed to support the analysis.
Movies play on Windows machines with : IntelIndeo5.1 CoDec and on Linux machines with precompiled XAnim binaries ( source distributions for Solaris and Iris end others are available here... )
The VRML files are viewed on Windows machines with Cortona and on Linux machines with openVRML or FreeWRL plugins.
Introduction: From the worm to the egg:
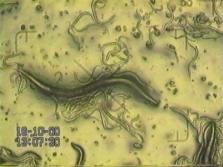
video of a C. elegans culture
C. elegans is a small free living soil nematode found commonly in many parts of the world. It feeds primarily on bacteria and reproduces with a live cycle of 3 days. Two sexes, hermaphrodites (females) and males are each about 1mm long. Hermaphrodites (females) produce both oocytes (i.e. unfertilized egg cell) and sperm. It can reproduce by self-fertilization. Males arise spontaneously at low frequency can fertilize hermaphrodites, hermaphrodites can not fertilize each other. Hermaphrodites lay about 300 eggs during its life span. C. elegans is a simple organism both anatomically and genetically. The adult hermaphrodite has about 959 nuclei and the adult male 1031 nuclei. The genome size is 8x10^7 nucleotid pairs, about half the size of the fruit fly Drosophila. C. elegans is easily maintained in the laboratory on agar plates. With a short life cycle and hermaphrodite mode of reproduction is well suited for developmental analysis. About 700 C. elegans genes have been identified, the total number of genes have been estimates at less than 5000.
The worm is of an egg. After hatching and 4 larval states the worm has complete development and produces eggs. We zoom in on the development processes that arise in the egg before hatching. These may be divided in two successive phases, the pre-morpho-genetic and the morpho-genetic phase. In the pre-morpho-genetic phase cells are produces and positioned in 3D space. In the morpho-genetic phase the cells have found their position and start to function as specific cells (i.e. nerve-, muscle-cell etc.). Again, we zoom in and deal only with the first phase, the pre-morpho-genetic phase.
A sorting process develops the egg to become an embryo
We do focus our observation on the very early development stages of an egg (pre-morpho-genetic phase). It is in the beginning of an egg, from the “one cell stage” to the approximately the “550 cell stage”, where the embryos structure is completely fixed. A cell-sorting process in 3D space appears to be fundamental on the way towards the fixed topology with determined biological functions.
First we follow an egg on its natural way to become a worm. Than we examine the adult worm, isolate an egg that is in the two cell stage and observe the development in a Laser Scanning Confocal Microscope. The observation is analyzed by mathematical means. Throughout the eggs development a the cell-sorting process becomes apparent. Cells are supplied and proliferated or ordered in space. It is this ordering and sorting phenomenon, that attacks our interest. The question arises here is in how far this process is causal for the function of one cell or the function of a cell-aggregate. Experiments have shown that especially in case of C. elegans only very few cell functions are determined by the interaction sequence that a cell experiences towards the final position and function.
In the beginning of a worm is an egg
video: birth of one egg
In the beginning is a mature oocytes (not jet fertilized egg cell) that pass through the spermatheca and become fertilized either by hermaphrodites own sperm, or by male sperm which are introduced into the uterus by mating. During 30 minutes after fertilization the zygote develops a though, chitinous shell which render the embryo impermeable to most solutes and able to survive outside the uterus.
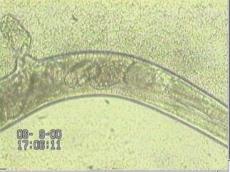
video: very early egg after fertilization
The video shows a female worm (hermaphrodite) on an agar plate under microscope 200 times enlarged. One egg is examined. The egg appears to be fertilized only minutes ago (zygote). Easily the one cell nuclei is visable.
State about 100 nuclei and at 1000 times magnification
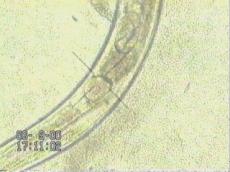
video: egg beeing still in pre-morphogenetic phase
The same egg hours later has approx 100 nuclei. It is kept in an 5% agar buffer solution and can develop in this environment to the adult stage.
video: hatching of the worm
The egg after approx. 10 hours 400 times enlarged. The worm moves inside the egg and breaks the shell to escape.
How to get one specific egg of one worm
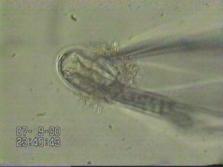
video: micro-manipulations
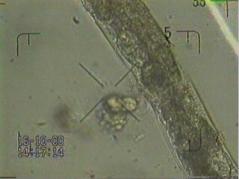
To examine one specific egg a worm must be dissected. There are other methods to get eggs of all stages of development. However, this method provided fast and good results. One worm is places in a 2% buffer under an microscope. From the right end left two electrodes attached to micromanipulators capture the worm in the center of the image.
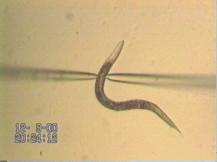
video: prepare eggs 1
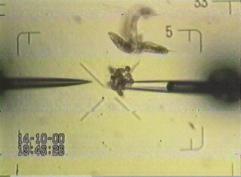
A fast way to get the desired egg is a brute force attack. The worm is simply cut at approx. 1/3 form the head or tail. The uterus is cut and the egg are thrown out. The scene can easily be examined to isolate the objects of interest for further processing.
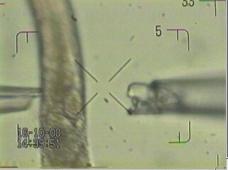
video: prepare eggs 2
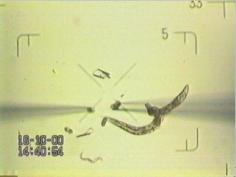
It is as well possible to gently cut the worm and isolate one egg out of the body. This needs a certain amount of training and is more time consuming than a brute force attack.
video: prepare eggs 3
The worms shape is controlled by an osmotic regulated pressure system. If the worm is placed in a 0.5 %to 1% buffer, the internal pressure expels eggs until an equilibrium is reached. The first egg bursts immediately after being thrown out. Increasing the osmotic pressure gradient by using distilled water results the worm to explode. However, at such a high osmotic pressure gradient the eggs are at risk.
Examine the scene and the eggs
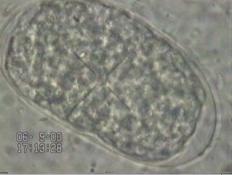
video: examine eggs
The scene of dissected worms by a brute force attack or after being exploded looks so like chaotic. The eggs are still in good condition (here in 2.5% buffer) and show one egg in a two cell stage. This egg is now the object of interest.
video: problems with dissecting eggs
Now its necessary to isolate the object of interest fast and place it soon under a LCSM. The next cell division is only minutes away, thus the above tissue aggregate is to be dissected fast. The object of interest can easily be located after this procedure.
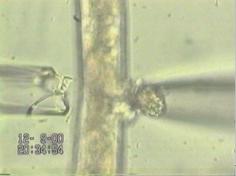
video: crop eggs
Once uterus is cracked, the eggs swim free in the agar buffer and are now cropped with the electrodes used as a hoover. The eggs are simply pulled into the electrodes by the capillary forces. Only to expel the eggs out of the electrodes or in extreme condition pressure is applied by an attached variable pipette. (A mouth tube is not used, but should work as well)
About microscopy images, 3D stacks and 4D sequences.
How to describe the sorting process that organizes the cell aggregate to become an embryo ?
Approach:
Model: We consider for the beginning a very simple model for the development of form or of shape. Lets imagine to build a house. For that purpose firstly a construction plan and secondly material is necessary. The construction plan may be provided by an architect. The material is delivered as brick. The brick now have to marked at the contact surface. The surface marker decide about the brick possible neighbors to contact. Thus every brick has its position in the aggregate of brick. The brick is now delivered or moved to the final position where it takes its function in a wall.
Experiment: The worms (C. elegans) egg is placed under a Laser Scanning Confocal Microscope. Images are taken of different z-positions at one stage of development. The same is repeated for every time step during the development.
Many 3D image stacks (a sequence) are produced this way for every state of development i.e. a 4D movie.
The cell nuclei positions are recorded in every image in a stack, and in all stacks of the 3D sequence. Result is a lineage tree in form of a database. Records of the database cell name, cell position, cell fate and many more data. These data assemble the cell-nuclei lineage tree.
One fundamental step of building the database is analyzing the microscopy data in order to follow the movements of nuclei in space-time (i.e. simply how it moves through the developing embryo (optical flow analysis)). This can impose serious problem and may be approached from two sides. Firstly it is the microscopy technique used to produce the raw imaged. Secondly it is the technique of analyzing the raw data. The microscopy technique and the methods of labeling certain objects with a fluorescent molecule (e.g. with GFP) is subject of later considerations. The problem of analyzing images by segmentation is principally solved. The program SIMI is equipped with a cross-hair cursor system that may record the time and spatial data using the mouse to move the cursor and the human eye to recognize the cell nuclei. A segmentation using a program depends on the qualities of images that may be relevantly enhanced with an adequately chosen microscopy technique. An example (by R.Schnabel) shows the following raw image
video: one z-slice of the egg development
and its segmented counterpart.
Compared with results segmentation algorithms, this one is very promising. However, a tradeoff between quality and computational cost exists.
The best results are achieved with electron microscopy images which even show whether the cell membranes to touch. But these can not be made of a living developing embryo.
These are examples of metal mirror fixation. Worms were processed at AECOM with the help of Frank Macaluso, at the Analytical Imaging Facility. They are also testing high pressure freeze fixations with Ya Chen at the University of Minnesota, and seeing similar improvements in preservation. A. Coelomocyte, showing endocytosis (arrows)
The above database may be browsed with a program that was specially designed for that purpose. The program SIMI can be used to build the database and to analyze the cell lineage tree. However, it is still difficult to different organism with respect to all information which are not contained in the lineage tree. A possibility to run projects in a distributed environment architecture would be as well desirable.
Fig 9. A cell linage tree (nuclei lineage tree i.e. the spatial position and the time of division) in the SIMI browser (SIMI Bio cell from Simi inc)
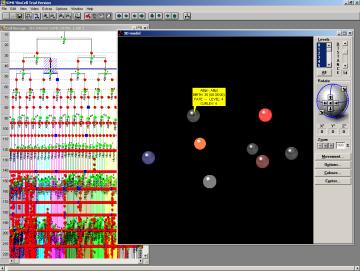
Fig.10 One cell position picked in the 3D browser module. The 3D module visualize the position of cells in space. Individual cells may be picked and the database record is displayed.
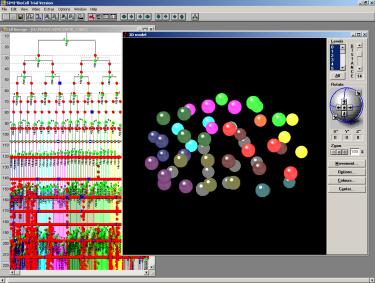
Fig.11 the same above just later in the development.
Visualize the cell path on the way towards its final position in the embryo
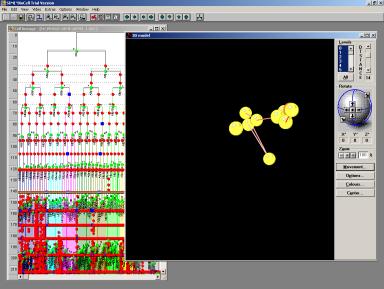
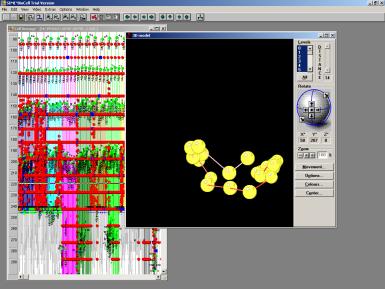
Fig 12 The movement of one cell in the aggregate of cells in the egg. The yellow balls are different the space-time positions of the same cell. The bonds are the displacements of the cell. Every displacement is associated with a change of topology and results in a new state of development.
This core question about the sorting process still remains to be solved. And a further problem is to compare the development of one individual organism to that development of another ?
We try an approach to find the rules of development as follows. The way to take should reveals a information about regularities in the sorting process.
At this point employment of mathematics appears to be sensible.
Spatial shape can be described with the mathematics of geometry. In geometry vectors spaces are used to embed objects. In the case of embedding an developing organism, we chose to design an eigen-vector space for the organism. The modifying operations observed in this eigen-vector-space are equivalent to the development of the embedded organism. Note here, that we do in fact deal with a multi-scale phenomenon. Therefore this eigen-vector-space is indeed a vector-space-cascade across the scales of the organism (egg > compartments > cells etc…).
Approach 1: Abstraction
Originally, the organism its self has nothing to do with a vector space or any other mathematical construct. A number of abstraction steps simplifies the organism to a set of mathematical objects. For these objects, vector space concepts are made applicable (as it is the case e.g. with quantum mechanics).
Abstraction step one.
One abstraction step reduces the organisms “relevant“ parts to geometric objects. In this case the simplest abstraction is to reduce the nuclei of cells to geometric points. In the co-vector-space this point is associated with a volume (of the cell). Delaunay triangulation and Voronoi tessellation are two fundamental algorithms employed. In this image the cells nuclei is contained in the space, and the cells membrane (with a volume) is contained in the co-space.
For simplicity, until this stage of analysis the egg in one certain stage of development may be embedded into a vector space by simply assigning every nuclei a geometric coordinates (x,y,z,time). These coordinates are read from the data base of the lineage tree mentioned above. As explained, the data base records contain the (x, y ,z ,time) coordinates of the nuclei, their time and position of cell-division, their name, their fate or function. In terms of system theory every cell would give rise to one degree of freedom. The “physical state” of the system is described by specification of the minimal and complete set of the degrees of freedom. Since in case of an organism almost every single cell may be considered as one degree of freedom, eventually we would deal with a 1031 dimensional system. To reduce the computational cost of handling this type data, cluster analysis is applied to the x y z and time data in the database. Further the cluster analysis will reveal the core data, that contains the relevant information for our proceeding.
The reduction of data is necessary to describe the organism development with a simplified set of approx 50 cluster values, instead of several hundred degrees of freedom. We begin simple. Lets consider the time values for nuclei division in the database.
Cluster the lineage tree time data
Fig.13 The ordinate shows the number nuclei divided at a time and the abscissa shows the state of development-time defined minutes.
Easily visible are division peaks and time gaps. One peak says that a certain number of nuclei divides at the same time (or stage of development). During nuclei division cells do not move. In the time gap between two nuclei division windows, the cells perform one move step. This division and move sequence repeats with every peak until every cell found its position.
The division-time peaks are clustered and the cluster mean values are taken as the representative for all cells in a cluster. These values are thereafter inserted into database.
Cluster of nuclei distances for one state of development.
Step 2. use the cluster data to “build” one organism.
Fig 14. Abstract object with topology (neighborhood relation) and metric in an vector space. The bonds represent the organisms topology. The balls are the representatives of cell cores. During the development towards the an embryo the topology changes.
In reconstructing the organism from the clustered data (i.e. using the reduced parameter set) the validity of the data is demonstrated. The parameters necessary for building or reconstructing the organism are chosen depending on the reconstruction environment and their condition. The simples choice for the relative nuclei distances is to set all distances to 1. Thus only one paraneter is used to describe relative distances. It shows that the organism can be reconstructed up to the 6-cell stage in a 3 dimensional environment. Successively increasing the set of allowed parameters (to 4 different relative distances) grows the complete organism to be embedded in 3D spatial space. The amount of allowed parameters corrolates ditecty with the resolution of the reconstrucion and it is very limited, since we do only deal here with structural information, where the structure is topologically coded.
Step 3. Topology is carried of structure information.
The same development state may be displayed using the above cluster values. All nuclei have now the same distance.
However: The important information about the shape of the organism remains untouched. This information is contained in the topology. And the topology has not been alternated modified up to this stage of analysis.
3D VRML scene
Something about computer algorithms, data formats and programs.
The following is raw output of the program qhull. The first half are geometric data, the second half are topological data. The data format organization is advantages for our forthcoming analysis topological characteristics. Further the topological data assign numbers as names for geometric objects in the first half. The topological objects are made of five points, since the first number is a 5 (saying simplex of 5 points) followed by 5 object-numbers or object-names. A simplex made of 4 points is a tetrahedron i.e. a 3D entity. A simplex made of 5 points is called a pentahedron i.e. a 4D entity. These are simply made of the nuclei-division positions and shared times. We consider these as “bricks” in the space-time development, which may be analyzed later. The topology the these “bricks” or we may call it development processes gives rise to the structure of development.
########################################################
303 6760 16905
15225 23.34375 397.0031 6.785938 231958827.4410282
15225 188.3984 294.9062 5.109375 231923114.7296339
17100 152.9778 288.7667 7.911111 292516850.999999
18150 198.65 302.532 7.988 329553551.241668
23962.5 240.8404 284.45 12.58654 574340480.5717614
24112.5 171.4527 327.9848 8.687656 581549701.7827351
24637.5 233.6615 255.2327 6.298077 607126187.3435054
24787.5 349.3326 284.3061 12.46844 614623174.9359159
28050 290.1856 347.8804 10.21196 787007832.7392784
28350 381.0208 349.0956 8.031855999999999 803989609.0986829
etc......
5 238 237 239 241 243
5 238 229 259 219 226
5 233 237 238 239 245
5 284 271 260 241 219
5 290 284 260 241 219
5 290 284 271 260 219
5 284 290 271 260 241
5 252 256 238 241 243
5 246 252 238 241 243
5 210 256 241 219 243
5 210 256 260 241 243
etc .............
Visualization leads not to the process causal for the phenomenon
One way of visualizing the data in the cell-lineage-database is the using the lineage tree browser SIMI. Another way is simply to take a sequence of division incidents (x,y,z,time) and visualize this time series of data read from the database (by Markus Gumbel). This type of demonstrations in an alternative way of looking at the database instead of reading records of names and numbers.
As a physicist, the next straight forward approach is to understand the development as a time series of events or as a function of time. One would try to view the function of time as a solution of a iterative differential equation. The differential equation describes the system and the solution represents the systems behavior in time.
However, the approach is of descriptive nature. It says nothing about laws or regularities which are invariant during the development of one embryo to another. The descriptive model must be able to predict the development. Usually the model is a system of differential equations. Such an approach mimics the real processes in nature but do not elucidate the principles behind them. Here the main deficit is that the influence of an memory (e.g. DNA) is neglected.
Instead visualization pictures data in a way, that is suitable for our human perceptional process of cognition.
Approach 2: available mathematical concepts
In the following the mathematical concepts of “vector space calculation”, “matrix operation” and the “Boundary Operator“ are made available for the study of the developing organism.
The above abstract construct of an organism may now be decomposed using simplexes, as they are known from geometry. The relative distances contained in the distance matrixes are assembled to 3 dimensional simplexes (i.e. a tetrahedral simplex). These geometrical simplexes are again subject to the composition of simplex-complexes. The simplex-complexes constitute the organism.
Simplexes (in a wider sense) may be used as a basis. A basis is conditional for the construction of a vector-space. Thus, this step enables us to use the vector space interpretation with simplex complexes as basis.
Now the vector space concept are available, which includes the space and co-space, cascades, Delaunay and Voronoi, Surface and Polygon relations.
Here only the topology without any coordinate system nor a geometry is considered. This reduces formutation can be presented in matrix form. (Consequently, all known matrix operation and concepty are availade as well)
The topology is described by matrices. A (e.g. connectivity or connectivity) matrix is indexed with a simplex sequence. An entry in the matrix means that the associated simplexes (at the index) are connected. Such a matrix may be visualized as a dot plot, where x and y are the index, and the entries are dots.
Example for a matrices visualized as dot plots in 3D

Fig 5. A dot plot of an adjacency matrix for the development state with 300 cells. The matrix dots connects two cells, thus one dot implements a bond in Fig 4. The matrix is not unique !
The topology is further analyzed in 4D using 4D simplexes as matrix index.
Fig 6. A dot plot of an 4D adjacency matrix. One dot represents the connectivity between two 4D simplexes. One The 4D simplexes may be considered as abstract processes of development in space-time. It is the topology of development processes or the structure of development.
The connectivity matrix reveals information about the structural development. The matrices (fig. 5 and fig. 6) may be re-index to give a new plot or image. Since these image still describes the same organisms topology, the description is not unique! Thus, it is impossible to compare two different organisms. Therefore, a normalized representation is necessary. The topological characteristics must be formulated in a normalized way. Thus one normalized topology is associated with exactly one biological spatial shape. Therefore, different organisms with different topologies become now comparable.
The normalization of organism topology is approached by analyzing the different permutation groups of the geometry. The normalized topologies (by Betten’s TDO) for the 4, 6, 8, 12 and 15 cell stages are shown as incidence matrixes.

video: Sequence of normalized states describes uniquely the development
Fig 7. A sequence of TDO normalized incidence matrices for the state 4, 6, 8, 12 and 15 cells. One matrix represents one state of development uniquely. The visible patterns are characteristic for one state. The transformation of one state into it's successor may be formulated as algebraically operations
The normalized topology is a unique formulation of the development. The topology is coded in the basis of the vector space. This space is inherent to the organism and independent of our laboratory space, invariant to translation, rotation and deformation of the organism.
Now there are two possible form of representation available.
These two formulation lead to the network representation of simplex-complexes. The network (of abstract objects) is decomposed in a “0” and “1” entry matrix formulation. To build a vector space with pysical characteristics, the matrix formulation must be enhanced by “the topological direction”. Thus, the matrix entries “0” “+1” and “-1” are introduced. A basis system with these space characteristics are capable to describe e.g. the physics of electrical networks (which are a special case of nonlinear thermodynamic networks (of e.g. chemical reactions)). The basis system is capable to formulate directed Force and Flux relation (e.g. of matter movements).
Further, by introducing a topological direction, the concept of the “Boundary Operator” is made available. Here the relation with reversibility, directions of chemical reactions and surfaces of compensating forces are introduced. The topological direction results in directed simplex characteristics.
The topology spans an independent-coordinate system in the organism. The organism can now be described independent of an absolute geometric coordinate system as used in SIMI.
The development of spatial shape may be described as normalized matrix operations implemented by a boundary operator in the vector space cascade.
The complete organism can be constructed using this abstract description.
The organisms construction can not be implemented without a context sensitive memory.
Model ó the architects construction plan
Nature ó DNA
It is now to find a corresponding topology and symmetry group structure on the DNA
In 4D space
The first problem is to scale the time of development such that is fits to spatial space without space distortion. Thus time can be mapped to space. Here, time of development is the cell-cycle of cell division.
The 4D space is advantageous for computation, since the complete development is static and represented at once.
Now, the topology in 4D space (i.e. the biological development) can be analyzed with the available mathematical concepts (i.e. vector-chains in a vector-space, matrix operations and boundary operations).
The abstractionof biological development may result in
These mathematical foundations are now to be filled with the contents of biology, biochemistry, molecular biology and other disciplines.
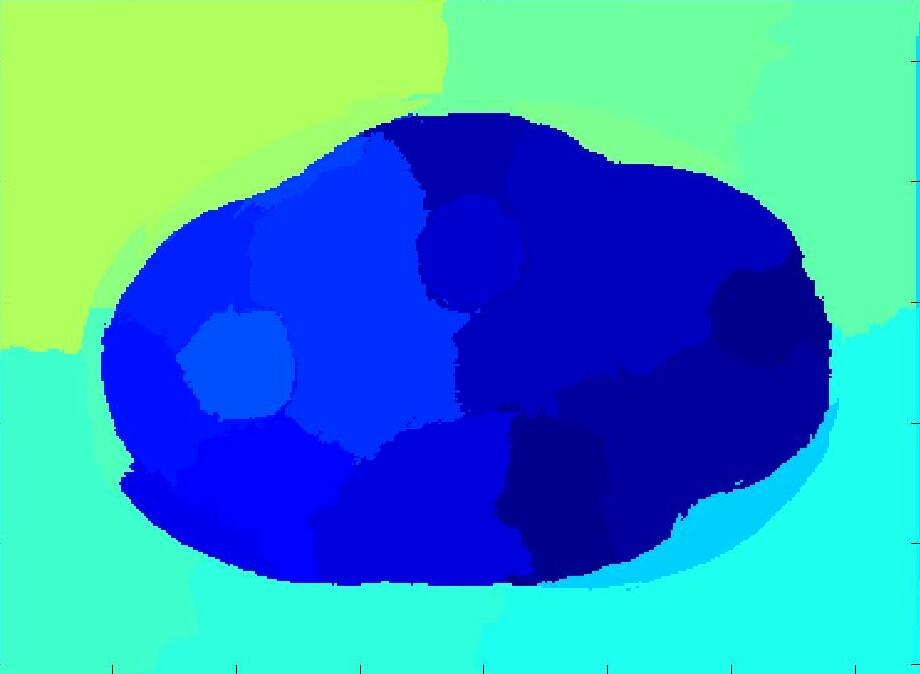
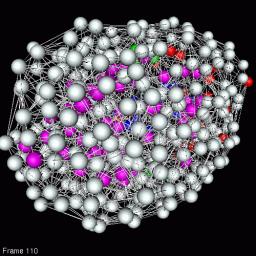
Visualization of 4D development processes in 3D (by Lewerents)
3D VRML Scene
Fig 11. The structure of development is spring embedded into 3D. One colored ball is a abstracted representation of a biological process of development with a certain function. The bonds represent the relative causality of two processes in space-time. The overall 3D displacements of the structure reflects the distance of processes. The topological structure of development is maintained.
Equivalent structures are obtained for economic data as well. In the case of the development of an economic organization the colored balls are the abstracted representation of economic development processes. Where the bonds represent their connectivity.